Tutorial
This short tutorial will get you started with Scree Painter.Please first download this sample data set that is needed for the tutorial. This is a small section of a map at 1:25,000 that illustrates all features of Scree Painter.
Step 1: Open the Data
Start Scree Painter and load the required data in the dialog that appears. Press the Select Data Folder… button and select the folder containing the sample data set. Scree Painter will recognize the various data sets by their names and load them. Click OK. Scree Painter's main window will open. Click the Show All button to fill the window with the loaded data sets.

Step 2: Generate the Scree
Press the Update button in the top center of the window. This will compute and display a scree pattern.Scree Painter per default only fills the Update Area that is represented by a red rectangle. This is useful for large map sheets for quickly adjusting settings. But for a small map, like the one used for this tutorial, this feature is not required. Press the Update Aera button to hide the red rectangle and press the Update button again. Scree Painter now fills the whole map with scree.


Step 3: Adjust the Size of Dots
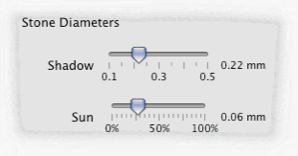
Scree Painter offers many parameters for adjusting the density, size distribution and shape of the generated scee dots. For a start, adjust the dot size with the sliders in the Size panel.For changes to be applied to the scree, press the Update button again.
Step 4: Explore the Data
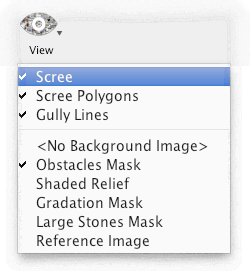
Select the data to display with the View button.Scree: the generated scree dots.
Scree Polygons: the polygons that are filled with scree dots.
Gully Lines: flow lines extracted from a digital elevation model.
Obstacles Mask: No scree dots are placed where this mask is black.
Shaded Relief: Modulates the size and density of dots.
Gradation Mask: Where this mask is dark, the contrast between bright and dark slopes is enhanced.
Large Stones Maks: Dots are enlarged where this maks is dark.
Reference Image: An image that is not used for generating scree dots. The reference image included in the sample data sets shows a map section with manually produced scree dots for comparison.
Step 5: Export the Scree Patterns
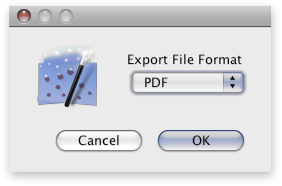
Select the Export Scree command in the File menu. A dialog appears for selecting the file format. Choose PDF and press OK. Confirm the following dialog for selecting the extension of the map to export by clicking OK and specify a file in the final dialog.